Data Discovery
Dashboard
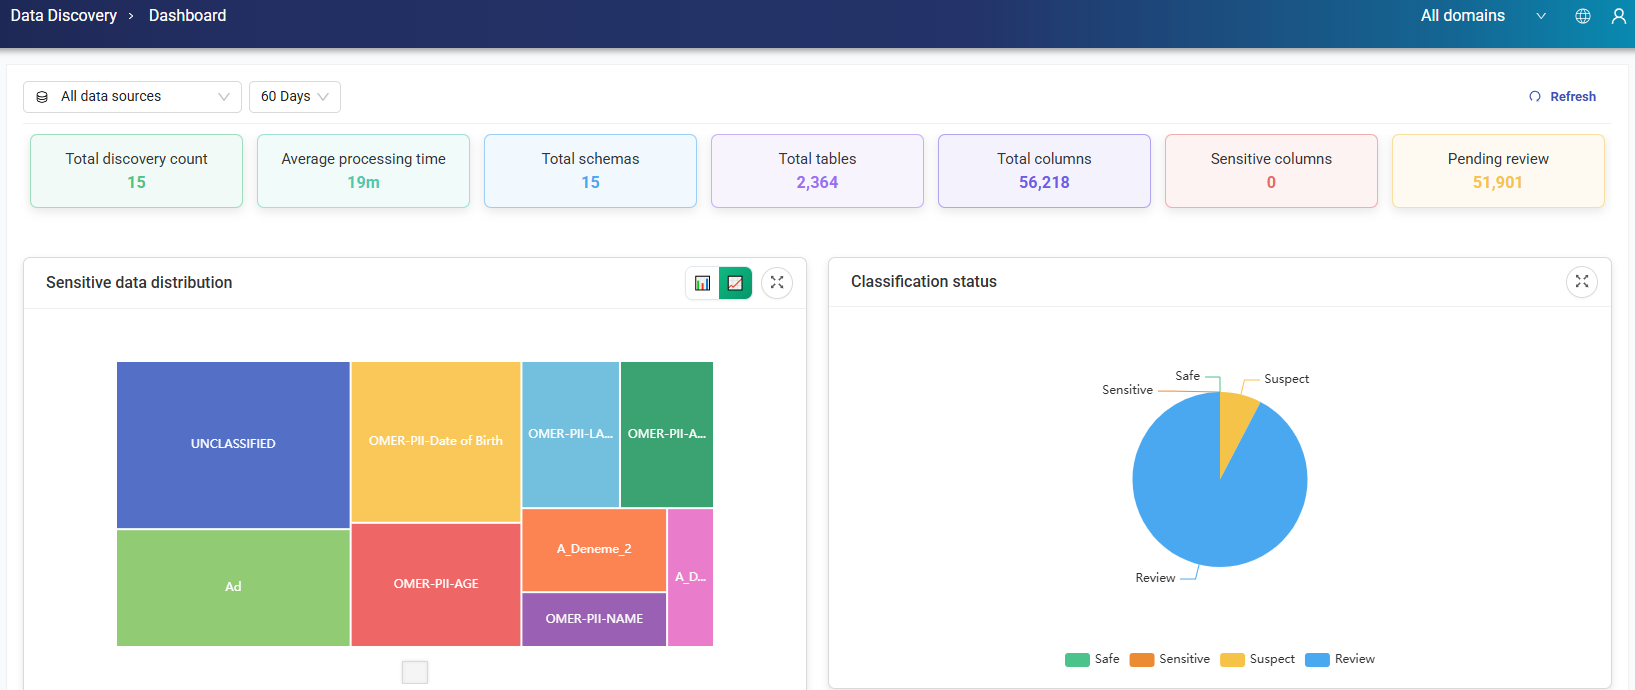
This dashboard provides an overview of the selected data sources. Users can filter data sources and choose a time range of 30, 60, 90 days, or custom.
It displays the following metrics:
-
Total discovery count
-
Average processing time
-
Total schemas
-
Total tables
-
Total columns
-
Sensitive columns
-
Column pending review
Sensitive Data Distribution: This graph visualizes the distribution of sensitive data across the selected data sources. Users can switch between linear and logarithmic scales to better analyze the data.
Classification Status: This pie chart shows the proportion of data classified as Safe, Sensitive, Suspect, or Review, providing a quick overview of the current classification status.
Discoveries
This area allows users to monitor and manage all ongoing data discovery jobs across multiple data sources from a single interface. Track progress, review results, and maintain full control over every discovery process in your environment.
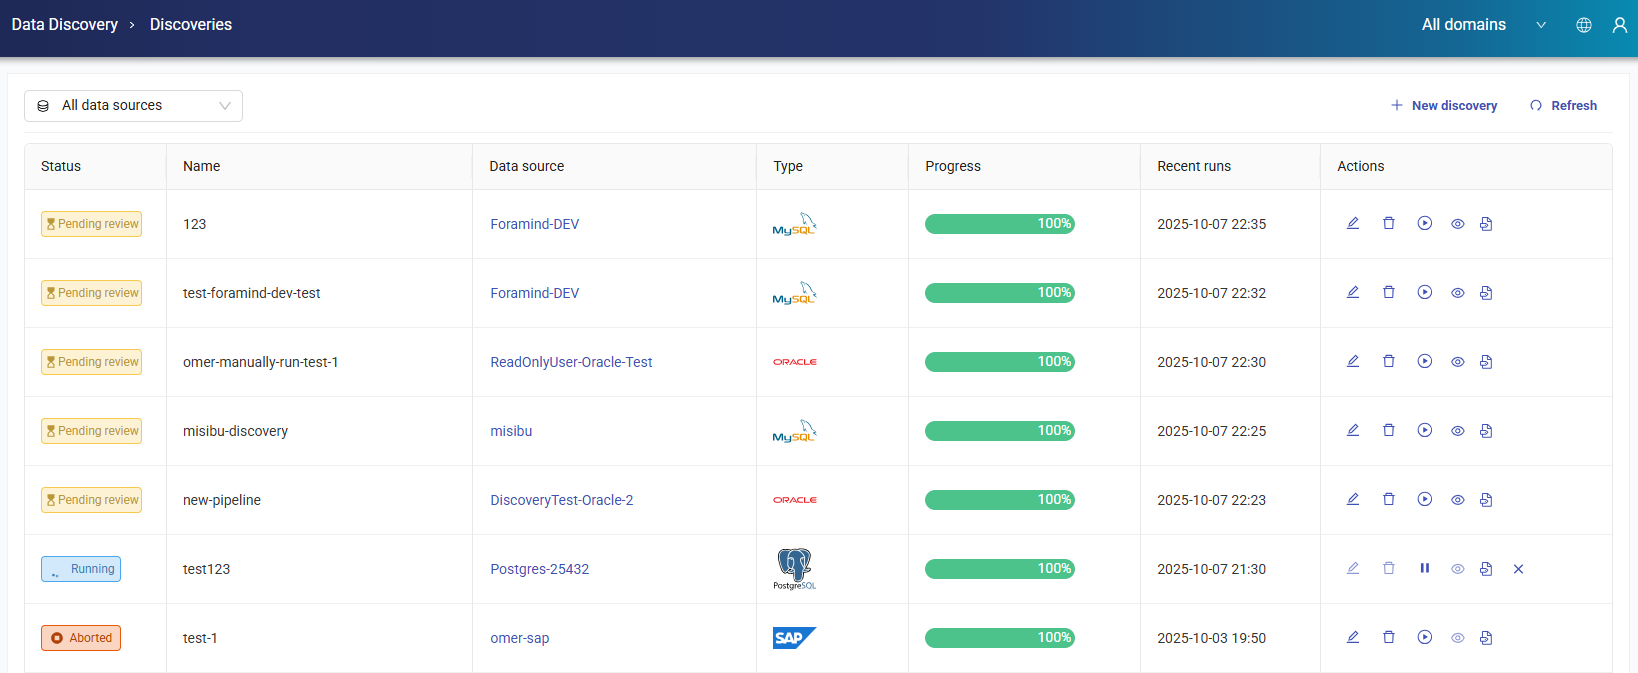
Available Actions
The following actions can be performed on discovery jobs:
-
Edit: Modify the selected discovery job.
-
Review: Open detailed scan results, including Scan name, Data source, Database type, Start and end date, and Total duration information. Includes Schemas, Tables, Column Filter, and Reports tabs.
-
Run/Pause: Start or pause the discovery process.
-
Others: Includes the View Details, View Logs, and Delete actions.
-
View Details: Displays detailed information about the discovery job, including Basic Information, Source Configuration, Performance and Sampling, and Rule Configuration settings.
-
Delete: Deletes the selected discovery job from the system.
-
View Logs: Displays the audit logs generated for the discovery job. Each log entry contains the date, log details, user information, related table, and associated columns.
-
Schemas Tab
The Schemas tab lists all schemas included in the discovery. For each schema, it shows the number of tables and how many of them were scanned. Clicking a schema name redirects to the Tables tab for further details.

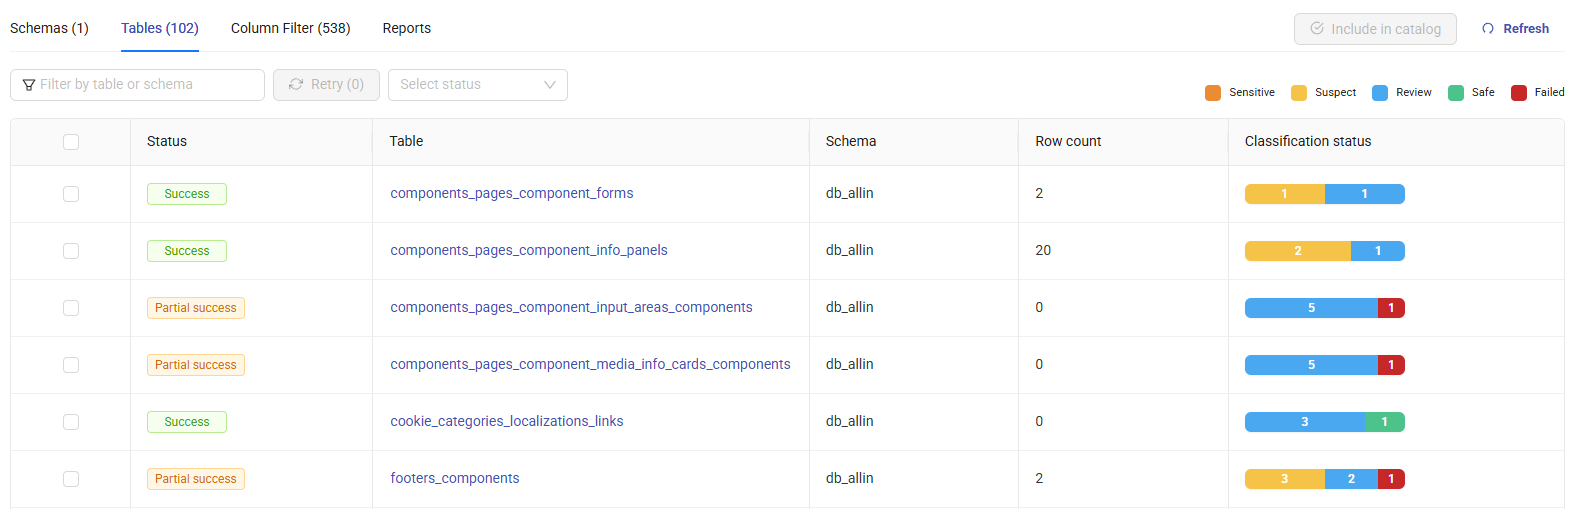
Tables Tab
The Tables tab provides detailed information about the discovered tables. For each table, it shows the Status, Schema (the schema the table belongs to), Row count, and Classification status information.
Clicking a table name opens its columns and column details. These details can be exported to Excel for further analysis.
Column Filter Tab
It provides an overview of column-level classification results. It displays a classification status pie chart along with lists of non-reviewed columns, reviewed columns, and the columns identified as safe, sensitive, suspect, review or failed.
Review with AI: Helps categorize classified content into the following groups:
-
Suggested: Columns for which AI has high confidence in the classification result.
-
Uncertain: Columns that require additional review due to low confidence or ambiguous classification results.
You can reanalyze selected columns at any time by clicking Reanalyze. This action reruns the AI-based classification process and updates the results accordingly.

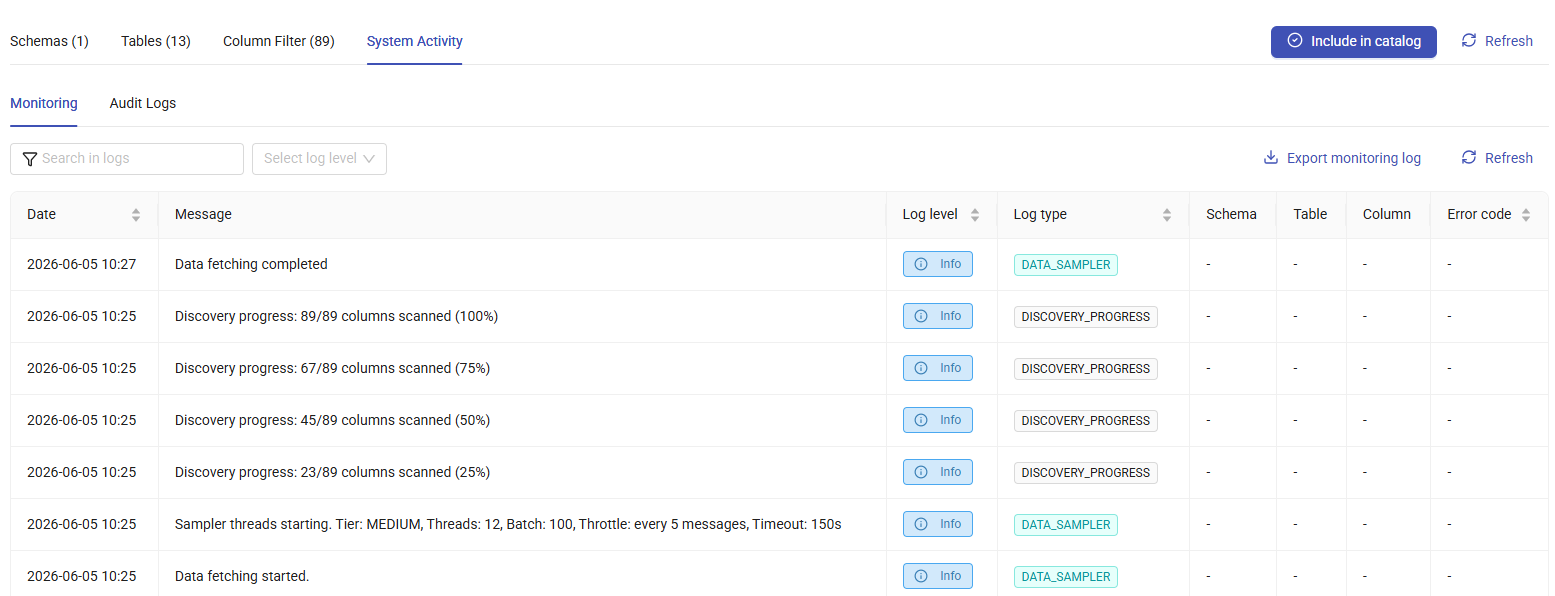
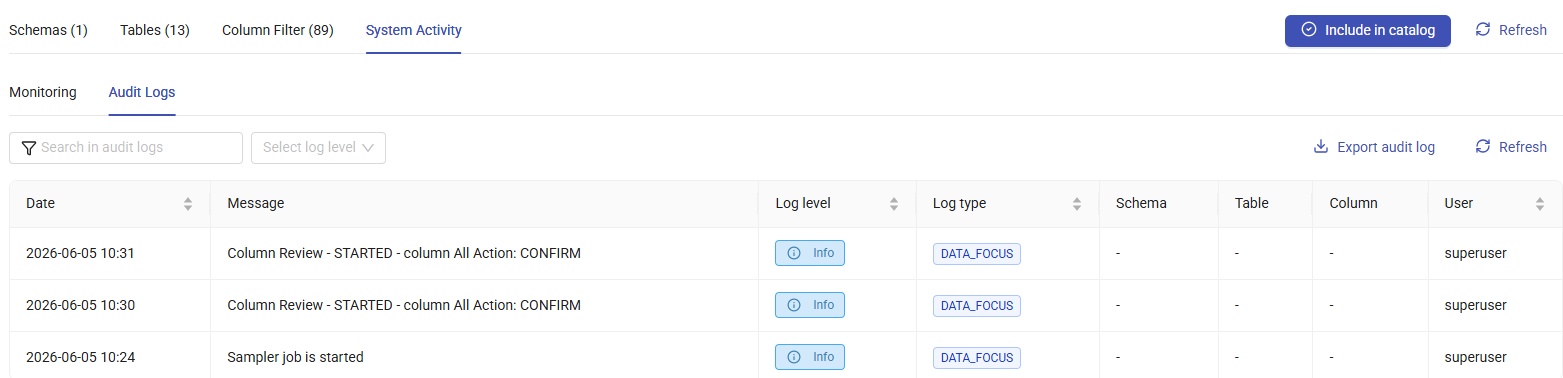
System Activity Tab
The System Activity tab provides access to monitoring and audit logs related to the discovery process.
-
Monitoring: Displays operational logs generated during the discovery process. Each log entry contains information such as the date, message, log details, schema, table, column, and associated error codes. To export monitoring logs, click Export Monitoring Log in the upper-right corner of the page.
-
Audit Logs: Displays user activities and system actions related to the discovery process. Each audit log entry contains the date, message, log details, schema, table, column, and user information. To export audit logs, click Export Audit Log in the upper-right corner of the page.
Creating a New Discovery
To create a new discovery job, click the + New Discovery button and follow these steps:
1. Source Configuration
-
Select a Data Source.
-
Enter a Display Name.
2. Rule Configuration
-
From the Laws & Standards menu, select the required standards and move them to the Selected area using the Add Selected Items button.
-
From the Classification menu, select the required classifications and move them to the Selected area using the Add Selected Items button.

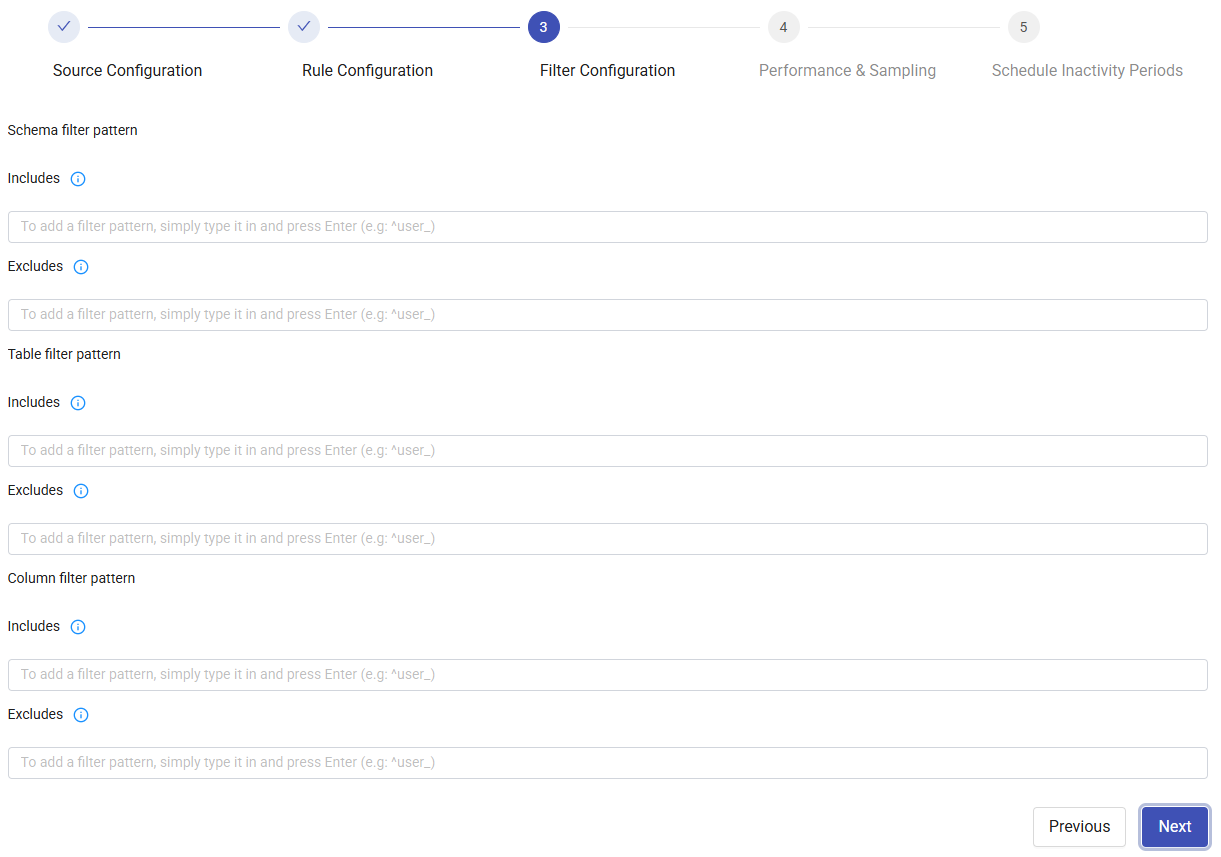
3. Filter Configuration
Define filters for Schema, Table, and Column using include and exclude patterns.
Include: Add schemas/tables/columns using regex patterns. Separate multiple patterns with commas.
Exclude: Exclude schemas/tables/columns using regex patterns. Separate multiple patterns with commas.
Examples:
.SNOWFLAKE.→ contains SNOWFLAKE^SNOWFLAKE.*→ starts with SNOWFLAKE^SNOWFLAKE$→ exactly SNOWFLAKE
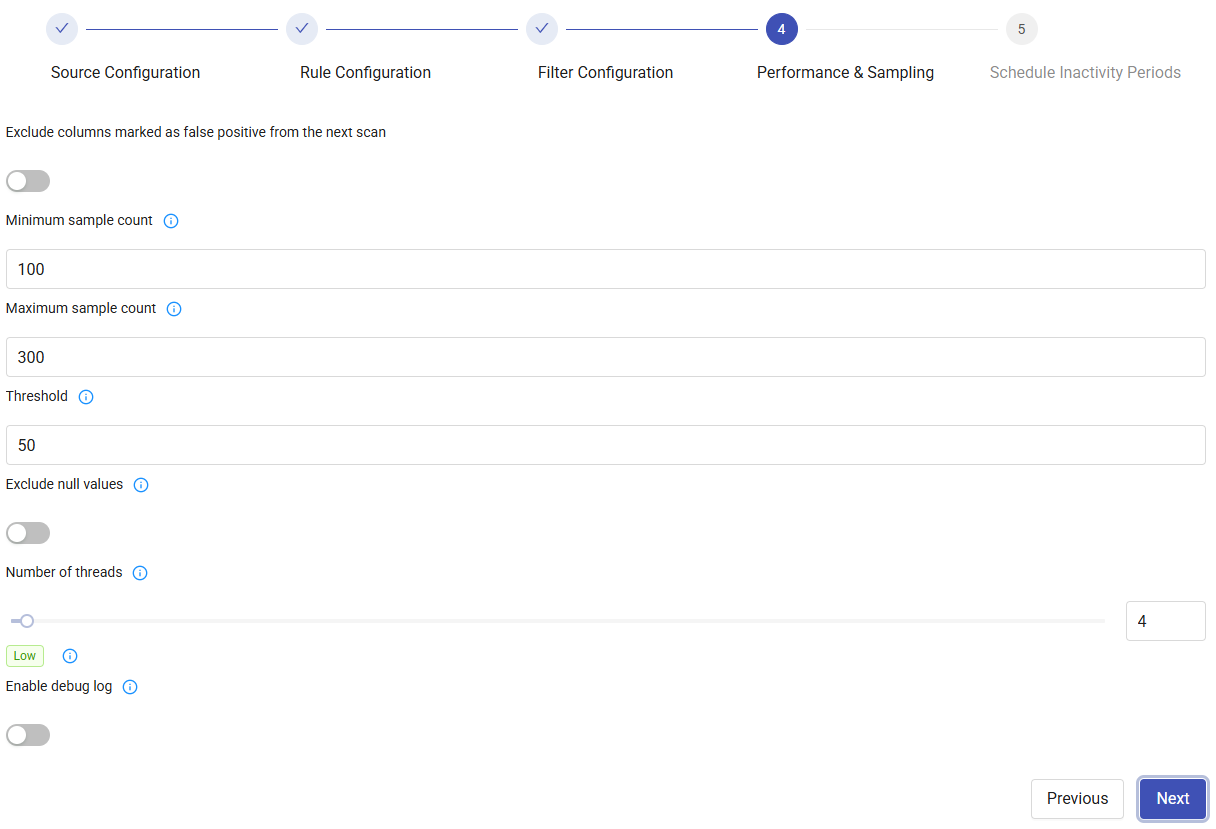
4. Performance & Sampling
- Choose whether to enable the Exclude columns marked as false positive from the next scan option.
- Enter minimum/maximum counts.
- Set the Threshold (percentage for classification detection, determining whether a classification is suggested as a candidate).
- Choose whether to enable the Exclude Null Values option.
-
Enter Number of Threads.
-
Choose whether to enable the Debug Log option.
5. Schedule Inactivity Periods
Define periods when the job should not run for performance optimization.
- Click Add for Blackout Period.
- Select the day and time range.
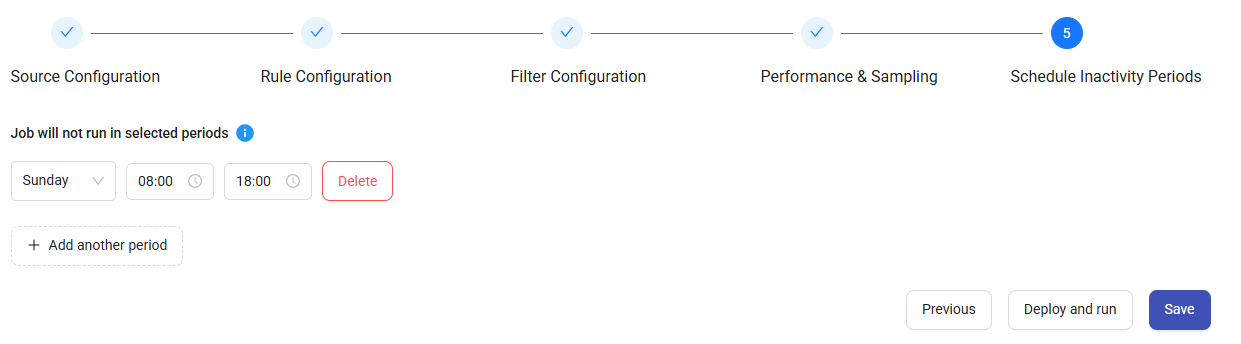
After completing all steps, click Save to store the configuration or Deploy and Run to start the discovery immediately.